Understanding how to describe line graphs is an essential skill for IELTS Line Graph Writing Task 1. These visuals appear frequently in the test and are designed to measure how well you can interpret trends, compare data, and explain changes clearly. With the right approach, a line graph becomes a friendly guide rather than a stressful hurdle. This IELTS Sure walkthrough will show you how to analyse any line graph and write a strong, well structured response.
Table of Contents
JOIN OUR WHATSAPP GROUP FOR UPDATES
What Line Graphs Show
Line graphs typically present changes over a period of time. They track rises, falls, stability, and fluctuations using points connected by lines. Your task is to summarise the overall trends, highlight key differences, and support your overview with accurate details.
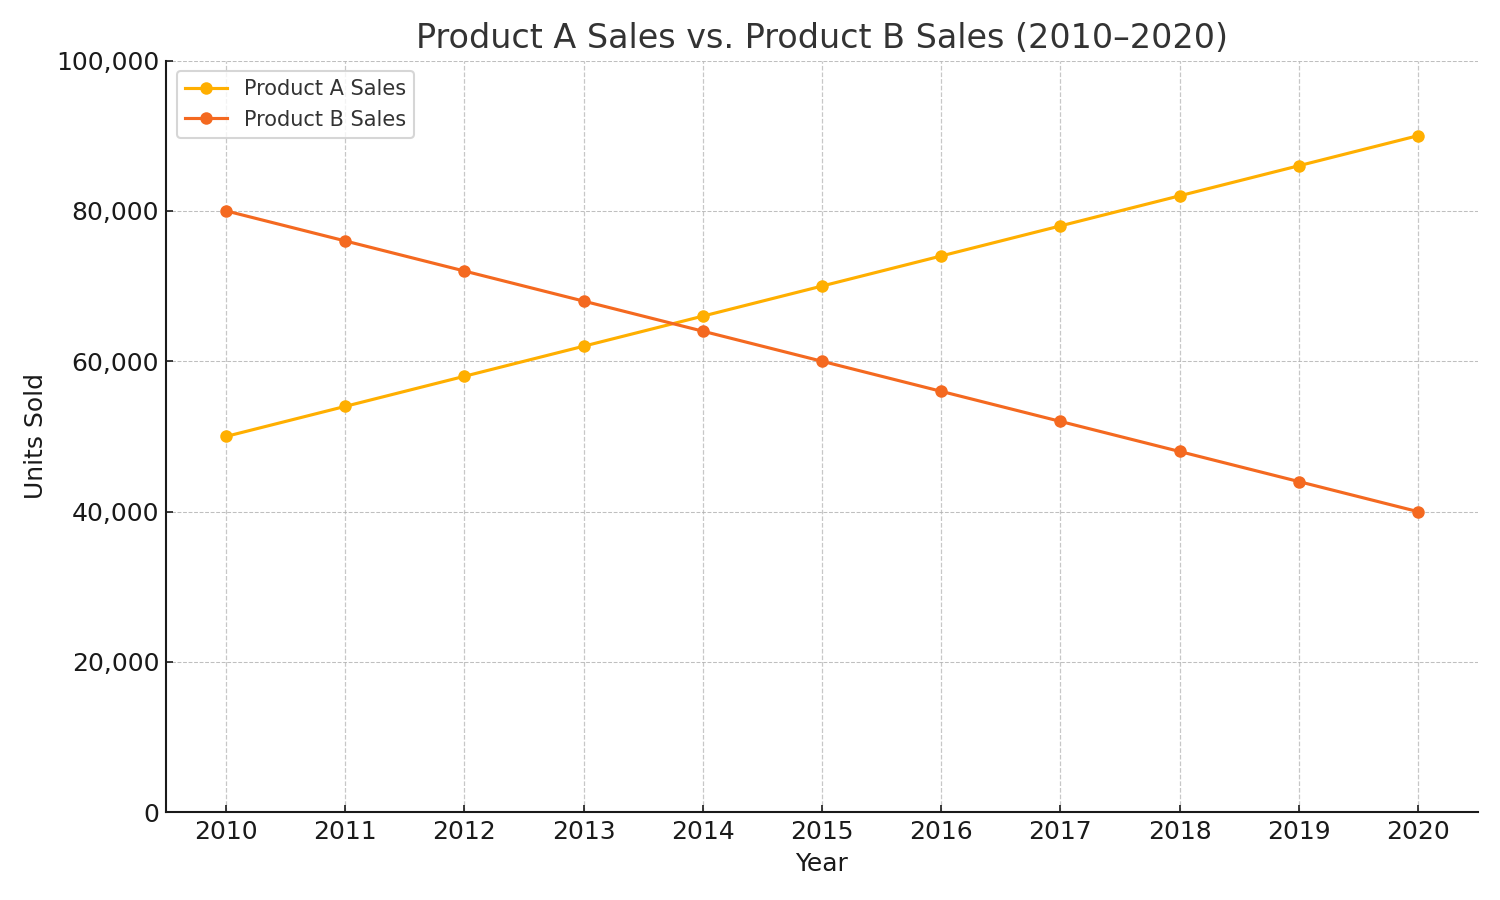
Here is a simple example of typical line graph data:
| Year | Product A Sales | Product B Sales |
|---|---|---|
| 2010 | 50,000 | 80,000 |
| 2015 | 75,000 | 60,000 |
| 2020 | 90,000 | 40,000 |
Graphs like these invite you to compare patterns, identify significant shifts, and point out the most noticeable features.
How to Approach IELTS Line Graph Writing in Task 1
A strong Task 1 answer relies on structure, clarity, and an understanding of what examiners want. You can treat it like assembling a puzzle, one piece at a time.
1. Read the Question Carefully
Before writing, take a moment to understand the time period, subjects being compared, and measurement units. This prevents errors later on.
2. Identify the Main Trend
Look for big movements. Did the numbers climb, drop, stay steady, or fluctuate? Your overview should give a broad summary without specific figures.
3. Group the Information
Rather than writing point by point, cluster similar trends together. This allows your writing to flow naturally.
4. Select Key Data
You are not expected to describe every number. Choose the main highs, lows, and turning points. These are the details that strengthen your analysis.
Why Time Management Matters in IELTS — and How to Master It to Achieve Band 7+
Tackling Your IELTS Line Graph Writing Response
A complete answer usually includes four parts, each with its own purpose.
1. Introduction
Rewrite the task description in your own words. For example:
The line graph illustrates changes in the sale of two products over a ten year period.
2. Overview
This is one of the most important parts. Summarise the major trends or contrasts. Keep it simple, like a bird’s eye view.
3. Body Paragraph 1
Describe the first set of trends, highlighting the clearest movements. Use comparative language and show the relationship between the items.
4. Body Paragraph 2
Discuss the second set of patterns. Bring in figures to support your explanation and show examiners that you understand the graph’s story.
Useful Vocabulary for IELTS Line Graph Writing Task 1
These expressions help you describe movement accurately and naturally:
| Trend Type | Useful Phrases |
|---|---|
| Rising | increased, climbed, rose, moved upward |
| Falling | declined, dropped, fell, decreased |
| No Change | remained stable, stayed constant, levelled out |
| Fluctuating | varied, shifted, moved inconsistently |
Using a mix of vocabulary makes your writing sound more polished.
Tips for a High Band Score
Here are practical IELTS Sure tips to boost your performance:
- Always start with the biggest patterns, not minor details.
- Avoid guessing reasons for the changes, stick to describing the data.
- Keep tenses accurate, especially when dealing with past years.
- Use linking words to guide the reader, such as additionally, meanwhile, however, overall.
- Write clearly and avoid overly long sentences.
Practice Makes Progress
Line graphs are predictable once you understand how they work. With regular practice from IELTS Sure materials, you will learn to quickly identify trends, organise your answer, and present information with confidence. Remember, the goal is clarity, accuracy, and a calm, structured approach.
IELTS Line Graph Writing FAQs
Begin with a short introduction that paraphrases the question, then write a one or two-sentence overview of the main trends before you give details.
Summarise the most significant movements, such as general rise or fall, any major peaks or troughs, and clear differences between the lines, without listing many numbers.
Pick the most relevant figures: the highest and lowest values and any turning points. You don’t need to mention every single year.
No, avoid speculating about causes. Task 1 asks you to describe the data, not to explain why it happened. Keep it factual and focused on comparison and change.
Use the past simple for completed periods, and present simple for general statements. For example, say “Sales increased from 2010 to 2015” rather than “Sales increase.”
Yes. Learn verbs for movement like increased, dropped, levelled off, and phrases for comparison such as considerably higher than, marginally lower, and a steady rise.