IELTS Bar Chart Task 1 questions often look more intimidating than they actually are. Once you understand how they work and what examiners expect, they become one of the most predictable visuals to handle. This guide from IELTS Sure walks you through understanding bar charts, organizing your response, and writing with clarity so you can aim confidently for a high band score.
Table of Contents
JOIN OUR WHATSAPP GROUP FOR UPDATES
What Is the IELTS Bar Chart Task in IELTS Writing?
In IELTS Bar Chart Question in Academic Task 1, you’re presented with a visual such as a chart, table, or diagram. With bar charts, data is shown as vertical or horizontal bars, each representing a quantity. Your task is not to write everything you see, but to summarize key information, highlight trends, and make meaningful comparisons in at least 150 words.
Example of a Typical Bar Chart
To help you visualize a common IELTS prompt, here’s a sample bar chart scenario:
| Region | Toyota Sales (2023) | Ford Sales (2023) | Honda Sales (2023) |
|---|---|---|---|
| North America | 500,000 | 400,000 | 300,000 |
| Europe | 300,000 | 250,000 | 200,000 |
| Asia | 400,000 | 300,000 | 250,000 |
| South America | 150,000 | 100,000 | 100,000 |
A question might ask you to summarize and compare the sales figures across these regions. The structure you use is what determines whether your answer feels messy or confident.
How to Write a Strong IELTS Bar Chart Description
Start With a Clear Introduction
Begin by restating the task using your own words. This proves you understand the content and can paraphrase naturally.
Example:
“The bar chart compares car sales for three manufacturers across four world regions in 2023.”
A clean introduction sets the tone for the entire response.
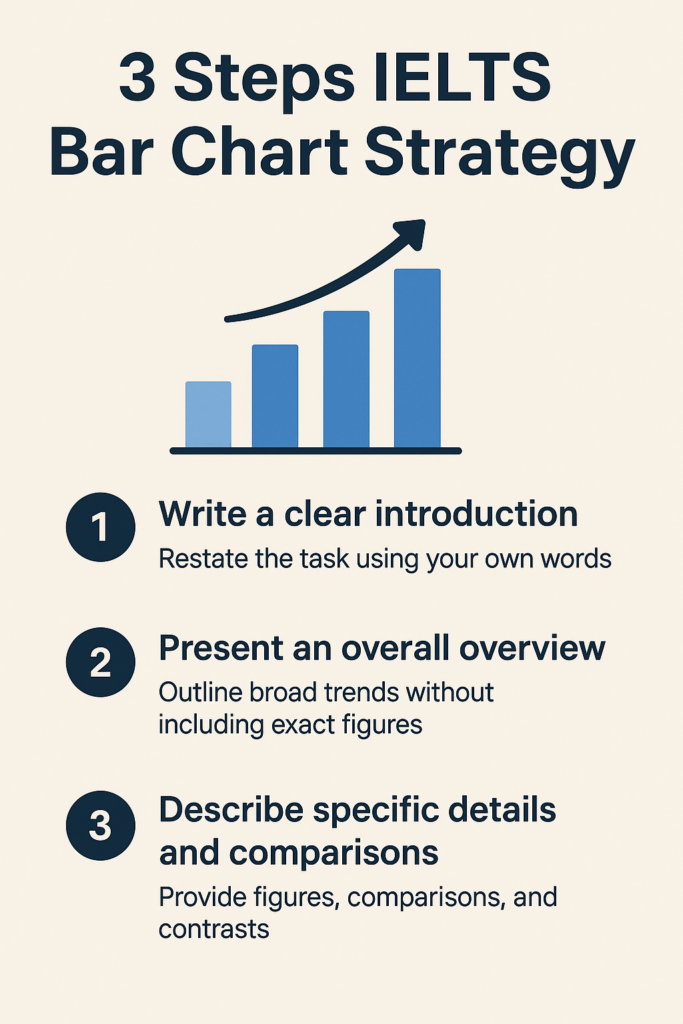
Provide an Overview
The overview is the heartbeat of your answer. Here, you identify the broad trends without including exact figures.
A strong overview might include:
✔ Which category shows the highest values
✔ Which category shows the lowest values
✔ Any clear contrasts
Example Overview:
“Overall, Toyota consistently recorded the highest sales in all regions, while South America registered the lowest numbers for every manufacturer.”
This tells the examiner you can see the bigger picture.
5 Proven Techniques to Boost Your IELTS Line Graph Writing Instantly
Add Clear, Logical Details
Now you dive into specifics. This section should include figures, comparisons, and contrasts organized into one or two body paragraphs.
Example Details:
“In North America, Toyota led with half a million units sold, followed by Ford at 400,000 and Honda at 300,000. Europe showed lower sales across all three companies, although Toyota remained ahead with 300,000 units. In Asia, sales were generally higher, with Toyota again topping the list at 400,000. By contrast, South America recorded the weakest performance overall, with Toyota selling 150,000 units and both Ford and Honda reaching only about 100,000.”
Focus on trends, not storytelling, and avoid unnecessary interpretation.
Tips for Scoring Highly
Understand the Chart Thoroughly
Before writing, take 1 minute to study the chart. Identify the highest points, lowest points, similarities, and noticeable patterns.
Use a Clear Structure
A high-scoring response usually follows this order:
- Introduction
- Overview
- Body paragraph 1 with comparisons
- Body paragraph 2 with additional key trends
Keep Your Language Academic
Use precise verbs like increased, declined, remained stable, overtook, exceeded.
Avoid emotional or opinionated language.
Compare, Don’t List
Examiners want to see connection between data points, not isolated numbers.
Common Pitfalls to Avoid in IELTS Bar Chart Task 1 Questions
❌ Listing every number in the chart
❌ Repeating vocabulary too often
❌ Ignoring the overview
❌ Adding personal opinions or explanations
Your goal is to inform, not to persuade or speculate.
Conclusion
IELTS Bar charts are one of the most coachable parts of IELTS Writing Task 1. With the right structure, a clear overview, and well-chosen comparisons, you can turn a graph full of numbers into a polished, academic description. Practice interpreting visuals, refine your paraphrasing, and keep your writing tidy and logical. Over time, you’ll see your confidence, speed, and band score grow.